Posts

Showing posts from 2015

Sorry the blog went all quiet for a bit!

Image
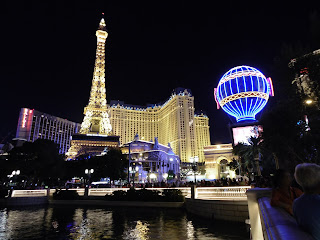
Although we have loved working with our participants in Rangiora and developing the CONA project, the sad truth is that we have other projects to look after too. Not since I was a PhD student have I had the chance to concentrate on just one project. This is the main reason why there have been no new blog posts now for over a month. I was at a conference - honest! But that doesn't mean that there have been no developments. One of the things I did in October was to present some initial results at an international conference in Las Vegas. The conference was held by the International Society for Exposure Science, of which I've been a member for years. It is attended mainly by scientists involved in understanding how the environment impacts our health, but also regulators from the US Environmental Protection Agency, plus other similar groups around the world. I made two presentations - one on the ODINs we used to detect high levels of woodsmoke in the air around Rangiora, plus anoth

Are there warm spots in Rangiora?

Image
In air quality lingo  we normally refer to small areas of increased pollutant concentrations as hot spots  but since this story is about the temperature  field I needed to use something else ... warm spots  will do. As part of the measurement campaign we deployed in Rangiora we not only used ODINs but also four weather stations (like the one on the picture) scattered around the town to explore small scale wind flows and how uniform or otherwise the temperature field is in the area. Before we dive too deep in the analysis, let's pause and look at the two kind of temperature sensors used here. First is the meteorological sites that have thoroughly calibrated and well housed thermometers, protected from the sunshine while the ODIN thermometers were ... well ... not perfectly housed (see image of the inside of an ODIN) and then put in plain sunlight attached to lamp posts (see image of ODIN attached to a lamp post). Now, don't despair! There is a reason why the ODIN temperature se

Temperature inside CONA homes

Image
The main reason we asked for some volunteers to accept temperature sensors in the home was to track when people were using their woodburners and how that might change from day to day. But the data from these sensors reveal a whole lot more information if you care to look and we’re just starting to look now. The sensors themselves were thermocouples provided on loan by BRANZ  the building research institute. They consist of a probe which was attached to the top of the firebox and a logger placed nearby. So far I have looked through data from 9 of the 14 homes we surveyed. In a moment, a taste of some of the things we can work out from the indoor temperature data. But first, a quick look at the outdoor temperatures. Below is a 'box plot'. All of the data from every days is combined and sorted into hours. The middle 50 % of all data lies within the box (the short horizontal line is the average). The top and bottom 25% are represented by the dashed lines. This chart shows that, o

What was the weather like during CONA?

Image
Pretty typical, really! In terms of understanding air quality we’re usually interested in three things: temperature, wind speed and wind direction. Air temperature might tell us something about how much home heating is going on (or it might not – that’s one of the things we want to confirm in this study). Wind speed tells us how much air pollution is going to be dispersed and diluted. Poor air quality in most New Zealand towns usually occurs on evenings when there are a combination of light winds and colder temperatures. Wind direction is interesting because firstly it is linked to wind speed and temperature. For example in Rangiora in winter south-westerly winds are often stronger and warmer and north-easterly winds are lighter and colder. Secondly, changes in wind direction may also tell us if smoke is being dispersed away from the town or just moved around. To find out what the weather was like we will firstly be looking at data from a permanent weather station on the edge of town r

What does the ODIN say .....

Image
Hopefully something more substantial than the fox! ... ( that song is still in my head after I let my kids get their hands on the radio!) [EDIT: Added missing link to full analysis script] Let's talk ODIN then ... Now that we have more data from the ODINs we can start to build answers to the questions: How uniform is the air pollution field in Rangiora? Is the plume of emissions recirculated under certain conditions? But there is a big caveat. The ODINs do not give us $PM_{10}$ and it cannot be directly compared to the measurements done by ECan. So ... let's dive in ... carefully. First, let's review where we installed the ODINs. Our original intention was to locate them in two west-to-east lines, one to the north of the town and another one to the south. We were fortunate to be able to use lamp posts for our deployments and Sally and Sam managed to get them pretty close to where we wanted them. This map shows the location of ECan's air quality stati

When do CONA participants light their wood fires?

Image
This initial analysis is going to focus on seven homes from which we were collecting data over 12 days in August. As part of the sign up agreement we promised not to share private data with anyone else. For that reason we will not be identifying which homes are which in this, or any similar analysis. Why are we interested in fire-lighting? To understand air quality in the town it matters a lot to know WHEN smoke is being emitted from people’s chimneys, and from how many. One of the things we know very little about is how much people vary the time they light their fire, or whether we are all creatures of habit and have the same fire-lighting routine each night. Does it depend on the weather, the design of our homes, our lifestyles? We know when our volunteers lit their fires because they had a thermocouple – a device which can measure high temperatures – fixed to the flue of their woodburner. When a fire is lit the temperature recorded by the thermocouple jumps up tens of degrees in jus

We put a PACMAN on someone's home but we weren't ready for what happened next ...

Image
Actually we were ... we got lots of data and that's what we wanted (sorry for the clickbait title ... a scientist has to have some fun right? ) Now in all seriousness, we were very pleased with the data from the first two weeks of PACMAN deployment in Rangiora. They allow us to test the units in a real world  setup outside of the researchers' control and evaluate whether the data we get from them can tell us something useful about the exposure of the people inside to particulate matter. Let's look at data from one unit PACMAN_17 and what it can tell us about the home it was living it. Temperature The PACMAN has an internal temperature sensor within its real time clock to keep it accurate. This is not quite room temperature  but it approximates it pretty well. See a comparison below between the temperature closest to the wood burner stack (BRANZ logger) and the internal PACMAN temperature. Not bad right! However, the same issue that I mentioned before remains ... it is not

Wow ... that's a lot of data!

Image
If you thought that we've gone away ... you're partly right, we've been away  but not in a bad way! About a week ago we got our first full set of data from a few of the participants in Rangiora and just to give you an idea ... for every home  we have about one million records with between 5 and 10 parameters each ... that's a lot of numbers! So, yes, we've been away but it has been trying to get our heads around this large dataset ... with various levels of success... as a German general said in the 1800s:  "No plan survives contact with the enemy" . At the beginning of this campaign we thought that the temperature data obtained through the iButtons  and BRANZ's loggers was going to be simple to interpret. High temperature = heater on, low temperature = heater off. The next level in complexity would be ECan's temperature and $PM_{10}$ data as it is standard compliant and we have a long time series for that location that would give us some context

CONA in the Northern Outlook again

Image
Thanks one more time to the Northern Outlook for covering the project. Front page this time! I think they covered the project quite nicely. Meanwhile the helikite is up again tonight and tomorrow so if you're in town, keep an eye out for it!

CONA Rangiora on ONE News tonight

Here's the piece ONE News put together on the project and broadcast tonight. Not bad, and thanks Annie! https://www.tvnz.co.nz/one-news/new-zealand/niwa-tests-revolutionary-air-quality-sensors-q07057.html

Flight of the helikite - night 1

Image
A perfect night for helikiting. Had One News around to witness the balloon being inflating and gradually raised into the air. The helikite has some meteorological instruments hanging from beneath it. It is held to the ground by a very strong cable which is winched up and down to different heights. Our NIWA team of Sally and Rowena got out the fleeces, woolly hats and soup and spent the whole night doing just that.   This information will help us understand if and when smoke is transported from ground level up above the rooftops and onto breeze, or trapped near the surface. The helikite caused a minor attraction with several cars pulling up to take a look ,and a few inquisitive children asking what we were up to. Dawn and the team are just finishing up. They catch some sleep now before doing it all again tonight.

Sam is ill and the TV are coming!

Image
CONA Rangiora is now well underway and some things are going really well. But it wouldn’t be as much fun if there wasn’t a few spanners in the works. Here is Sam beating an ODIN into submission. (photo Ian Longley) Firstly, most of the early participants will have been contacted by, or met, our Instrument Scientist, Sam. Sam is based in our Christchurch office and is running the ODINs, the PACMANs and the thermometers in volunteer’s homes. He is also currently confined to his couch at home having picked up the winter bug. This means a (hopefully short) pause in that part of the project. Get well Sam! Meanwhile the project has attracted a bit of positive attention and a crew from TVNZ will be in town tonight, primarily to capture some shots of the helikite which will be making its maiden voyage above the town this evening. And we are nearly at the point of getting a feel for how well the data capture for the project is going as a whole. Before long it will already be time to start think

A ceilometer in a paddock ... what is it?

Image
A place to keep cows, but that's not important right now (if you need help with the reference ... see here ) By Worldview999 (Own work) [CC BY-SA 3.0], via Wikimedia Commons In atmospheric science we're always looking to have information about the vertical structure of the atmosphere. We can deploy weather stations to measure the wind speed and direction but we're always missing what's going on in the air above us. Of course there are ways to get information from higher in the air and we'll be using one of those in this project (helikite) which we'll cover when it's operating in Rangiora but now I'd like to talk about another piece of kit that we have deployed in the town. A Ceilometer . Ceilometers are intended to measure the ceiling , which means the height of the lowest cloud. These sensors send a light pulse and measure its reflection from clouds and aerosol layers to obtain this height. Ceilometer installed near the AWS site in Rangiora. Photo by Sa

And we now have 5 ODINs

If you remember , we had some troubles with our outdoor sensors last week and one of them is still in pieces in our bench and the sledgehammer looks very tempting at this stage! I think that the rest of the units heard the message and are now behaving better . However, we're not entirely happy as a large peak in $PM_{10}$ concentrations observed on the night of the 11th of August was not captured by any of our units. Unfortunately we didn't get good weather (too warm) last week to test for another large peak in concentrations so we deployed the ODINs to their target locations last Friday and I'll be very busy looking at the data when we have the first download this coming Friday... stay tuned.

A quick update on recruitment

A crucial part of this project, and one that we've stressed about a lot, is the recruitment of volunteers to respond our survey and host instrumentation. After a couple of weeks of recruitment efforts we're very happy with the results so far: 14 volunteers who want to fill our survey and 13 of them are willing to host instruments in their homes. That's more than we were hoping at the beginning! However, we still need more people, particularly on the eastern part of town as well as from newer subdivisions (most volunteers reported their homes built more than 20 years ago) and with older woodburners. So, reach out to your neighbour and help us increase the participants' numbers for this project.

A tale of six ODINs

Image
On Tuesday I told you about the tests of our PACMAN units before they were being deployed in our volunteers' homes. Now is the turn of ODIN (Outdoor Dust Information Node). A little bit of history ... After the first PACMAN deployments we realised that we needed to have information from the outside of the home as well as the inside so we developed a stripped down version of PACMAN focusing solely on the dust measurements. Here you can see a presentation we gave about the ODIN after the very first tests.   Now, we have six ODINs to be deployed in Rangiora but before we go ahead and distribute them across the town we need to know that they are working fine so we set all of them up at ECan's air quality station in Rangiora. For this test we're looking for indications that the units are recording all the data, that the temperature looks plausible and that the dust sensors respond to something other than temperature. In simple terms, we're looking for plots t

Is Canterbury air quality really improving like ECan say?

Good timing! Just as CONA gets underway in Rangiora, a story appears in The Press (10 th August 2015), and elsewhere, covering the latest air quality monitoring data from Environment Canterbury (ECan). The Press article states: “ Christchurch's air quality is improving but there are still too many high pollution days, monitoring data shows. The article also mentions that Rangiora has again failed to meet the National Standards that it is legally required to do so by 2016. However, understanding whether air quality is, or is not getting better is much more complicated than you might think. Being able to answer this seemingly basic question is one of the main scientific aims of CONA. To find out more check out our longer article on the topic.

We're in the Northern Outlook today - page 3

The Northern Outlook is the local paper covering North Canterbury. A nice piece on page 3 and a headline banner on the top of page 1. Thanks to the folks at Fairfax Media! You can find the article here: http://fairfaxmedia.newspaperdirect.com/epaper/viewer.aspx  (although I don't know how long they keep it up there).

CONA press release is out – that means we’re officially GO!

With thanks to my colleagues at the NIWA Media Office we did our first project press release on Monday. You can check it out here . It was immediately picked up by Newstalk ZB and I’ve had interest from One News. This project officially exists and it’s too late to change our minds and scrap the whole idea. Our main media goal at this stage is to aid recruitment of participants to do our online survey and host instruments in the home (if you haven’t registered, just go to www.niwa.co.nz/CONA-Rangiora ). Press releases are nervous times for scientists. What generally happens next is that reporters and producers call me up and expect me to give a few sound-bites on the spot. I have to have a few key messages in mind and keep it simple. Unless it’s live I get the chance for a few do-overs if I stumble. The tricky bit is always the unanticipated question, and there always is one. With Newstalk ZB I was asked how much locals can buy the air quality sensors for. That threw me, because they ar

Waka Waka Waka Waka

Image
Here is PACMAN in its native environment One of the key pieces of hardware we're deploying in this campaign is our PACMAN ( Particles, Activity and Context Measurement Autonomous Node ) ... not this pac-man . This little unit is capable of logging air quality parameters (dust concentrations, $CO_2$, $CO$), activity information (motion, distance to closest object) and context (time, temperature) every second. We expect to use this information to estimate what drives the indoor concentrations of dust in homes. All the participants that want to have instruments in their home will have one of these units installed but before we can do that we need to test if they are working as expected. So, we set them up in a bench facing a wall for a few days and as it is normal with experimental technology, not all of them worked perfectly but most of them did so we are go for PACMAN deployment. If you're curious as to what the data looks like ... here is a link to the test results of one of

How many ODINs do you need to change a lightbulb?

Image
That's a trick question, I haven't told you what ODINs are! Well, ODIN stands for O utdoor D ust I nformation N ode and it is the name of our low-cost outdoor dust sensor. You may ask why not calling it "low-cost outdoor sensor" to which I would respond: for the same reason that Apple doesn't call their phones "high-cost shiny communication devices". A lot goes in a name and I believe that for a project to be successful it needs a good name. So, as strange as it sounds, we have a Norse god gathering data for us. The sensors themselves are rather simple. At the heart of the ODIN is an optical dust sensor that, together with a temperature and relative humidity sensor and a clock send data to a microcontroller which saves it on a micro-SD card. The ODIN is battery operated and it can run unattended for two months on a full 6Ah LiPo battery. Simplified schematics of ODIN (left) and an actual ODIN (right) with its internal components visible. A more in depth

Welcome to CONA

Great, you found us! In this case us  is the Urban Air Quality and Health group from the National Institute of Water and Atmosphere in New Zealand (NIWA) and our objective with this platform is to document and share the development of our CONA  project that started in August 2015 in Rangiora (New Zealand). Have a look at the what is CONA   page for more details about this project and maybe to register your interest in participating. In the coming weeks, expect to see here comments and stories about how things go in this project, from " look at these great looking data!  " to " I swear that if it didn't cost $20000 I'd throw this thing out the window right now!"  Because every research project has a lot more "that's weird" and "but it worked before!" moments than what you'd guess from the pretty plots we generate in the end. And also because a big part of this project is to work closer with the resident community and for that we ne