Posts

Showing posts with the label analysis

What does the PACMAN say?
Image
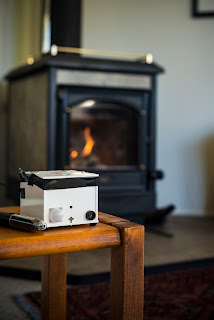
Our keen tinkerer, Gustavo Olivares, started building the first PACMAN back in 2012, I think. We wanted a device that could not just measure indoor particle levels, but would give some clues as to what was causing and controlling them. After 3 years of tests it was not until last year in Rangiora that we finally got around to using PACMAN for the job it was originally intended. Observing rapid changes in particle levels in real homes in a wood-burning setting. The PACMAN technology is low cost and they are each custom-built by amateurs (we are air quality scientists not electronic engineers). Some of them failed, some reported data that was 'contaminated' (by what, we're not yet sure). But some worked beautifully and did exactly what we wanted. Here's an image of a PACMAN in action. This is real data from one of our participant homes, covering one day. You can see three lines which are levels of measured dust, carbon dioxide and outdoor particle levels (PM10) measured b...

Sorry the blog went all quiet for a bit!

Image
Although we have loved working with our participants in Rangiora and developing the CONA project, the sad truth is that we have other projects to look after too. Not since I was a PhD student have I had the chance to concentrate on just one project. This is the main reason why there have been no new blog posts now for over a month. I was at a conference - honest! But that doesn't mean that there have been no developments. One of the things I did in October was to present some initial results at an international conference in Las Vegas. The conference was held by the International Society for Exposure Science, of which I've been a member for years. It is attended mainly by scientists involved in understanding how the environment impacts our health, but also regulators from the US Environmental Protection Agency, plus other similar groups around the world. I made two presentations - one on the ODINs we used to detect high levels of woodsmoke in the air around Rangiora, plus anot...

Temperature inside CONA homes

Image
The main reason we asked for some volunteers to accept temperature sensors in the home was to track when people were using their woodburners and how that might change from day to day. But the data from these sensors reveal a whole lot more information if you care to look and we’re just starting to look now. The sensors themselves were thermocouples provided on loan by BRANZ  the building research institute. They consist of a probe which was attached to the top of the firebox and a logger placed nearby. So far I have looked through data from 9 of the 14 homes we surveyed. In a moment, a taste of some of the things we can work out from the indoor temperature data. But first, a quick look at the outdoor temperatures. Below is a 'box plot'. All of the data from every days is combined and sorted into hours. The middle 50 % of all data lies within the box (the short horizontal line is the average). The top and bottom 25% are represented by the dashed lines. This chart shows that, o...