Posts

Showing posts with the label data

What does the PACMAN say?
Image
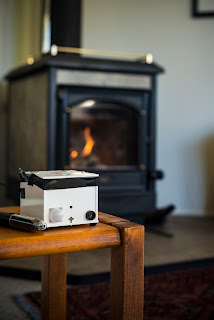
Our keen tinkerer, Gustavo Olivares, started building the first PACMAN back in 2012, I think. We wanted a device that could not just measure indoor particle levels, but would give some clues as to what was causing and controlling them. After 3 years of tests it was not until last year in Rangiora that we finally got around to using PACMAN for the job it was originally intended. Observing rapid changes in particle levels in real homes in a wood-burning setting. The PACMAN technology is low cost and they are each custom-built by amateurs (we are air quality scientists not electronic engineers). Some of them failed, some reported data that was 'contaminated' (by what, we're not yet sure). But some worked beautifully and did exactly what we wanted. Here's an image of a PACMAN in action. This is real data from one of our participant homes, covering one day. You can see three lines which are levels of measured dust, carbon dioxide and outdoor particle levels (PM10) measured b...

Are there warm spots in Rangiora?

Image
In air quality lingo  we normally refer to small areas of increased pollutant concentrations as hot spots  but since this story is about the temperature  field I needed to use something else ... warm spots  will do. As part of the measurement campaign we deployed in Rangiora we not only used ODINs but also four weather stations (like the one on the picture) scattered around the town to explore small scale wind flows and how uniform or otherwise the temperature field is in the area. Before we dive too deep in the analysis, let's pause and look at the two kind of temperature sensors used here. First is the meteorological sites that have thoroughly calibrated and well housed thermometers, protected from the sunshine while the ODIN thermometers were ... well ... not perfectly housed (see image of the inside of an ODIN) and then put in plain sunlight attached to lamp posts (see image of ODIN attached to a lamp post). Now, don't despair! There is a reason why the ODIN tem...

Temperature inside CONA homes

Image
The main reason we asked for some volunteers to accept temperature sensors in the home was to track when people were using their woodburners and how that might change from day to day. But the data from these sensors reveal a whole lot more information if you care to look and we’re just starting to look now. The sensors themselves were thermocouples provided on loan by BRANZ  the building research institute. They consist of a probe which was attached to the top of the firebox and a logger placed nearby. So far I have looked through data from 9 of the 14 homes we surveyed. In a moment, a taste of some of the things we can work out from the indoor temperature data. But first, a quick look at the outdoor temperatures. Below is a 'box plot'. All of the data from every days is combined and sorted into hours. The middle 50 % of all data lies within the box (the short horizontal line is the average). The top and bottom 25% are represented by the dashed lines. This chart shows that, o...

What does the ODIN say .....

Image
Hopefully something more substantial than the fox! ... ( that song is still in my head after I let my kids get their hands on the radio!) [EDIT: Added missing link to full analysis script] Let's talk ODIN then ... Now that we have more data from the ODINs we can start to build answers to the questions: How uniform is the air pollution field in Rangiora? Is the plume of emissions recirculated under certain conditions? But there is a big caveat. The ODINs do not give us $PM_{10}$ and it cannot be directly compared to the measurements done by ECan. So ... let's dive in ... carefully. First, let's review where we installed the ODINs. Our original intention was to locate them in two west-to-east lines, one to the north of the town and another one to the south. We were fortunate to be able to use lamp posts for our deployments and Sally and Sam managed to get them pretty close to where we wanted them. This map shows the location of ECan's air quality stati...

We put a PACMAN on someone's home but we weren't ready for what happened next ...

Image
Actually we were ... we got lots of data and that's what we wanted (sorry for the clickbait title ... a scientist has to have some fun right? ) Now in all seriousness, we were very pleased with the data from the first two weeks of PACMAN deployment in Rangiora. They allow us to test the units in a real world  setup outside of the researchers' control and evaluate whether the data we get from them can tell us something useful about the exposure of the people inside to particulate matter. Let's look at data from one unit PACMAN_17 and what it can tell us about the home it was living it. Temperature The PACMAN has an internal temperature sensor within its real time clock to keep it accurate. This is not quite room temperature  but it approximates it pretty well. See a comparison below between the temperature closest to the wood burner stack (BRANZ logger) and the internal PACMAN temperature. Not bad right! However, the same issue that I mentioned before remains ... it is not...

Wow ... that's a lot of data!

Image
If you thought that we've gone away ... you're partly right, we've been away  but not in a bad way! About a week ago we got our first full set of data from a few of the participants in Rangiora and just to give you an idea ... for every home  we have about one million records with between 5 and 10 parameters each ... that's a lot of numbers! So, yes, we've been away but it has been trying to get our heads around this large dataset ... with various levels of success... as a German general said in the 1800s:  "No plan survives contact with the enemy" . At the beginning of this campaign we thought that the temperature data obtained through the iButtons  and BRANZ's loggers was going to be simple to interpret. High temperature = heater on, low temperature = heater off. The next level in complexity would be ECan's temperature and $PM_{10}$ data as it is standard compliant and we have a long time series for that location that would give us some context ...