Posts

Showing posts from 2017

So long, Rangiora - hello world!

Image
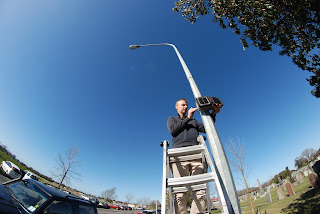
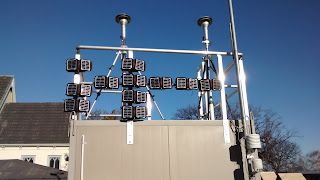
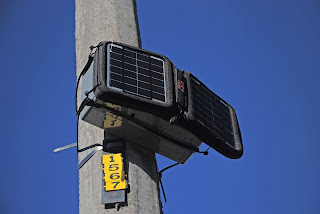
On 13th September the ODIN air quality sensors were removed from the Rangiora lampposts they were attached to and collected together at the Environment Canterbury monitoring site for their final co-location test. Next week they will be removed from there and retrieved to our base in Christchurch. However, it's not all over for our little friends. After a check-over they will be packed up into a box and will begin their world tour. They will first be heading for the University of Montana in attractive mountain valley city of Missoula. Two ODIN units actually made an advance trip earlier this winter. Much of Montana has been suffering from huge wildfires pouring thick smoke across the towns and cities (see this article, for instance: https://www.missoulacurrent.com/outdoors/2017/09/missoula-smoke-health-effects/ ). We're working with colleagues at the University to see if the ODINs can be used to track this unpredictable hazard. After some testing, the Rangiora ODINs will then be

How much do people use their woodburner?

Image
One of the big science questions behind the CONA project is: How much do people use their woodburner? Or perhaps, more precisely, does the amount they use their woodburner change much from day to day? Why? And is the variation predictable? Another question we're interested in being able to answer is - if homes are supplied with new burning technology (maybe a new woodburner, or a catalyst, or different fuel) how can we measure if it has changed the amount they use their woodburner (and the amount of smoke their burner generates)? Starting in mid June we began to send temperature sensors to 8 homes in Rangiora. We asked householders to fix one to their woodburner flue and one elsewhere in the living room. After 2 - 3 weeks we sent them some more and asked them to send the original ones back to us for analysis. A temperature sensor on a woodburner We have just completed our analysis of that original data for 5 of our homes and sent some results back to the householders. 2 to 3 weeks

New Zealand's air quality still fails to meet standards, even after 5 year extension

Image
New Zealand's National Environmental Standards for Air Quality were introduced in 2004. Regional Councils were given responsibility to make sure air met those standards by 2011. After some years it became clear that that target date was not going to be met. So the regulations were amended, and Councils were given until September 2016. So, as of last week at least 18 "airsheds" (i.e. towns or cities) were in breech of the standard for particulate matter (PM10), according to monitoring data collected by Councils and posted on the national environmental data website ( www.lawa.org.nz ), with 4 more at risk of breaching the standard before the winter is over. The standard is based on the daily average level of airborne particulates, PM10. A daily average above 50 micrograms per cubic metre is termed an 'exceedence'. Each town is permitted a single exceedence per year, mainly to allow for atypical events like Guy Fawkes night or freak meteorological events. After that

The ODINs are back - and so is the smoke!

Image
After their spectacular success last year our fleet of low-cost particulate sensors - the Outdoor Dust Information Node or ODIN - are back in Rangiora. An initial fleet of 13 have been installed at Environment Canterbury's monitoring site in the centre of town and will remain there until next week. After that they will be distributed to different locations around the town. ODINs under test at the ECan monitoring site in Rangiora And not a moment too soon. Last Sunday (11th June) saw Rangiora's first exceedence of the National Environmental Standard for PM10 of the year. This means that the level of PM10 (airborne particles smaller than 10 microns or small enough to enter the lungs), averaged over 24 hours (midnight to midnight) exceeded 50 micrograms per cubic metre. The rules (part of the Resource Management Act) state that Rangiora, like many other towns, were not allowed to have more than one exceedence per year from 1st September 2016. So Rangiora has now had its permitted

We're not alone - learning from woodsmoke researchers around the world

Image
We like to think of CONA as doing something pretty unique and ground-breaking. There are a several research projects around the world looking at new low-cost air quality sensors and how they can be used to enable citizens to become scientists. But there are very few, if any, looking at this in the context of smaller towns and the problem of woodsmoke from home heating. But there are a small number of researchers around the world interested in these issues. Last year we at NIWA managed to convince the NZ government that this was an area of research in which New Zealand can play a major global role. We were able to get funding from the Ministry for Business, Innovation and Employment to set up an International Woodsmoke Researchers' Network . The Network was launched in July 2016 with a mixture of public and invitation-only meetings in Wellington. We were able to bring 8 international experts over representing the US, Canada, Sweden, Finland, the UK and Australia. Later in the week t

Our first animated air quality maps

Image
In a recent post we revealed our first map of local air quality , created solely from our network of low-cost air quality sensors - the ODINs (Outdoor Dust Information Nodes). This map is based on the average levels of airborne particles over nearly a whole month (August 2016). This data was collected by 16 ODINs spread across our study town of Rangiora. But we are actually recording data every minute. And the pattern of pollution can change rapidly. But really, you don't want to just take my word for it - the data is crying out to be animated. Luckily for us, NIWA has some pretty nifty visualisation software that we routinely use to create brilliant weather and climate graphics like the one below (I highly recommend 'liking' NIWAWeather on facebook).   So, what happens when we plug the ODIN data into the same computer system?   Below is our first attempt. It depicts two days of air quality data from 2016. Note the time in the top left corner.  

Air quality can be good as well as bad

Image
The CONA project exists because poor air quality is a big problem. It causes real discomfort, illness and impairs the health of thousands across New Zealand.  It also violates our views, tarnishes our towns and is generally the dirty little secret of our apparently clean, green country. But air quality can be good as well as bad. Especially in New Zealand. It is in the nature of our legislation that Regional Councils, like Environment Canterbury, will invest resources in monitoring air quality in locations where it can get bad, and report when it does indeed breach acceptable standards. But the flipside is that there is very little data, and even less media coverage, when and where our air quality is excellent. And excellent is exactly what it is most of the time across most of the country. Looking through the ODIN data from our 2016 pilot study I came across exactly such a time and place. Dr Sam Edwards installs an ODIN on a beautiful clear day in Rangiora Our study focussed on winter

Too hot, too cold, or just right?

Image
In a country where poor air quality is dominated by woodsmoke a study on air quality often turns into a study on home heating. And CONA is no exception. This is why from the start we asked Rangiora householders to allow us to put tiny temperature sensors in their homes, and especially on their woodburners. We previously posted on how we use this data to detect WHEN people are using their woodburners.It also allows us to collect data on how effective that heating is, and how good, or bad, each home is at retaining that heat. One of our miniature temperature sensors on a woodburner Well, that's the idea anyway. However, whilst looking at the 2016 study data we discovered that, like much in science, it ain't as easy as it looks. The data from the woodburners was highly variable between houses, probably depending on exactly where we put the sensor. Placing the sensor is tricky, because every home and every woodburner is different. We don't know what we're going to get unt

Our first air quality map

Image
One of the main things we wanted to show with CONA is that air quality is not the same everywhere - even across a small town like Rangiora. Until now information about Rangiora's air quality came from only one monitoring site - the one run by regulator Environment Canterbury (ECan) in the centre of town. It reports levels of particulate matter (PM) every hour. You can find this data at www.lawa.org.nz , or download it from ECan ( data.ecan.govt.nz ). Now, however, for the first time we can combine data from the 16 ODINs we had installed at various locations around the town to produce a map of average particle levels during the month of August 2016. Map of average PM2.5 levels across Rangiora in August 2016, based on interpolation of ODIN data (green = low, red = high) Now you've seen the map, here comes the disclaimers, how we did it and what it means. Firstly, this map should be treated as preliminary. With further analysis it might change slightly. It is created by firstly av

Are the new ODINs any good?

Image
The ODIN is a new outdoor air quality monitoring technology. It is WAY cheaper than the existing technologies used around the world and across New Zealand. Regulators, researchers and the public are right to be sceptical about the quality of data coming out of it. So before we present any results from the ODINs, we need to convince you (and especially ourselves) that the data is any good. Firstly, some very quick history. The first ODINs were built and tested in Rangiora in 2015 using the same dust sensors we used in the PACMAN. That was promising, but soon after that test we discovered some new sensors coming out of China (Plantower PMS3003). We tested a few and they worked really well. We then built a fleet of 18 new ODINs with the new sensors. These were what we used in Rangiroa in 2016. So, to evaluate them we took them down to ECan's regulatory monitoring site in Rangiora and ran them there for 2 weeks in July 2016. We did the same again at the end of our study in October. ODI

What was CONA Rangiora 2016 all about?

Image
In winter 2016 the CONA project went back to Rangiora in Canterbury for a second year. In 2015 we'd trialled two new air quality sensing technologies - the PACMAN for indoors and the ODIN for outdoors, as well as doing detailed measurements of meteorological parameters like wind speed, direction, temperature and humidity around the town. We learned that we could use PACMAN to distinguish smoke being generated in the home from smoke seeping into the home from outside. We also found that changes in the wind shortly after sunset seemed to moving smoke around to different parts of the town. So why did we go back for another winter? What did we hope to learn? The 2016 study focussed on three main themes: Upgrading the ODIN sensors and scaling up the network from 6 to 18 stations. Pairing some of the ODINs with PACMANs by placing outside the homes of our participants to learn more about the origin of smoke in the home. A more thorough evaluation of the performance of the new sensors by c

Is that NIWA air quality project still happening, or what?

Image
In short... YES! In fact, we're getting ready to gear up to launching some bigger and better air quality projects over the next few years exploring what new technologies offer scientists and communities alike. Firstly a quick apology that we got out of the blogging habit last year. But our winter 2016 CONA study in Rangiora was hugely successful.We'll reveal how and why over a series of forthcoming posts. Now we're busy getting ready for our third CONA pilot study. This will focus, one more time, on Rangiora in Canterbury. However, we are also considering whether we are ready to trial some of the CONA technologies and methods in other towns. More details to come soon... Finally, we have been putting together a longer-term vision of how we aim to move CONA forward from a science experiment to something that can be adopted by communities and Regional Councils, and equivalent organisations overseas. We've been applying for larger research funding grants and been in convers