Too hot, too cold, or just right?
In a country where poor air quality is dominated by woodsmoke a study on air quality often turns into a study on home heating. And CONA is no exception.
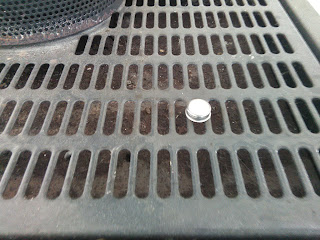
This is why from the start we asked Rangiora householders to allow us to put tiny temperature sensors in their homes, and especially on their woodburners. We previously posted on how we use this data to detect WHEN people are using their woodburners.It also allows us to collect data on how effective that heating is, and how good, or bad, each home is at retaining that heat.
Well, that's the idea anyway.
However, whilst looking at the 2016 study data we discovered that, like much in science, it ain't as easy as it looks. The data from the woodburners was highly variable between houses, probably depending on exactly where we put the sensor. Placing the sensor is tricky, because every home and every woodburner is different. We don't know what we're going to get until we turn up at the home. Also, last year, we started trialling mailing some sensors out for householders to install themselves which means we have even less control over how it is set up.
So, we decided to do a test. At one of our own homes we set up 14 temperature sensors at various locations on, next to and above a woodburner, trained a video camera on the firebox, and then set it going.
Our sensors can handle a maximum temperature of 140 degrees C. The ones above the woodburner got hotter than this. This caused them to report erroneous data. The ones to the side or on the base or hearth, and on the walls warmed up only slightly and very slowly. This meant they weren't able to tell us when the fire was lit.
Only 2 sensors gave us just what we wanted - close and hot enough to respond quickly and unambiguously to the fire being lit, but not too hot to go off-scale. These two were both on the flue guard. The data is shown below. The time that the red lines jump up in response to the fire being lit is obvious. There are then two short-lived jumps in temperature. These related to the firebox being re-loaded with new wood. The jump in temperature wasn't immediate but occurred about 5 minutes after re-loading. The fire was then left alone and you can see the temperature smoothly fall for the rest of the experiment.
We think the 'iButton" sensors we use are ideal in many ways. They are easy to handle and send through the post. They are easy to operate, download and get at and plot the data. They are relatively cheap and could be deployed over hundreds of homes simultaneously (which we plan to do at some point in the future. But we found that the instructions for their use has to be very carefully planned to make sure we hit that goldilocks point - not too hot, not too cold, but just right!
This is why from the start we asked Rangiora householders to allow us to put tiny temperature sensors in their homes, and especially on their woodburners. We previously posted on how we use this data to detect WHEN people are using their woodburners.It also allows us to collect data on how effective that heating is, and how good, or bad, each home is at retaining that heat.
 |
| One of our miniature temperature sensors on a woodburner |
Well, that's the idea anyway.
However, whilst looking at the 2016 study data we discovered that, like much in science, it ain't as easy as it looks. The data from the woodburners was highly variable between houses, probably depending on exactly where we put the sensor. Placing the sensor is tricky, because every home and every woodburner is different. We don't know what we're going to get until we turn up at the home. Also, last year, we started trialling mailing some sensors out for householders to install themselves which means we have even less control over how it is set up.
So, we decided to do a test. At one of our own homes we set up 14 temperature sensors at various locations on, next to and above a woodburner, trained a video camera on the firebox, and then set it going.
 |
| Our test woodburner and location of 14 temperature sensors shown |
Our sensors can handle a maximum temperature of 140 degrees C. The ones above the woodburner got hotter than this. This caused them to report erroneous data. The ones to the side or on the base or hearth, and on the walls warmed up only slightly and very slowly. This meant they weren't able to tell us when the fire was lit.
Only 2 sensors gave us just what we wanted - close and hot enough to respond quickly and unambiguously to the fire being lit, but not too hot to go off-scale. These two were both on the flue guard. The data is shown below. The time that the red lines jump up in response to the fire being lit is obvious. There are then two short-lived jumps in temperature. These related to the firebox being re-loaded with new wood. The jump in temperature wasn't immediate but occurred about 5 minutes after re-loading. The fire was then left alone and you can see the temperature smoothly fall for the rest of the experiment.
 |
| Temperature record from the two sensors in the best position - on the flue guard |
Comments
Post a Comment