Are the new ODINs any good?
The ODIN is a new outdoor air quality monitoring technology. It is WAY cheaper than the existing technologies used around the world and across New Zealand. Regulators, researchers and the public are right to be sceptical about the quality of data coming out of it.
So before we present any results from the ODINs, we need to convince you (and especially ourselves) that the data is any good.
Firstly, some very quick history. The first ODINs were built and tested in Rangiora in 2015 using the same dust sensors we used in the PACMAN. That was promising, but soon after that test we discovered some new sensors coming out of China (Plantower PMS3003). We tested a few and they worked really well. We then built a fleet of 18 new ODINs with the new sensors. These were what we used in Rangiroa in 2016.
So, to evaluate them we took them down to ECan's regulatory monitoring site in Rangiora and ran them there for 2 weeks in July 2016. We did the same again at the end of our study in October.
What do we mean by 'data quality'? We are looking for several things.
So before we present any results from the ODINs, we need to convince you (and especially ourselves) that the data is any good.
Firstly, some very quick history. The first ODINs were built and tested in Rangiora in 2015 using the same dust sensors we used in the PACMAN. That was promising, but soon after that test we discovered some new sensors coming out of China (Plantower PMS3003). We tested a few and they worked really well. We then built a fleet of 18 new ODINs with the new sensors. These were what we used in Rangiroa in 2016.
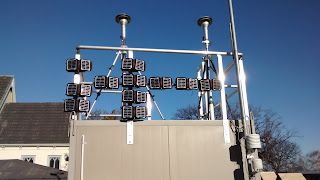
So, to evaluate them we took them down to ECan's regulatory monitoring site in Rangiora and ran them there for 2 weeks in July 2016. We did the same again at the end of our study in October.
 |
| ODINs being tested at the ECan monitoring site in Rangiora. The two 'chimneys' are the air intakes for ECan's instruments which are in the shed below |
- Correspondence with a reference instrument - do the ODIN-reported levels go up and down when the reference instrument does?
- Interference - does anything cause the ODIN levels to go up or down other than particles in the air (temperature and humidity are common interferences on other instruments)
- Variability between units - are some more or less sensitive than others and by how much?
- Stability - once we've answered the 3 questions above, does the performance change over time?
- Firstly (unlike in 2015 with the earlier version) we had no instrument failures.
- They all reported data that corresponded with the reference instrument.
- We observed no obvious interferences.
- There was variability in sensitivity between instruments, but the variability was highly stable. This means it can be compensated for by calculating an 'adjustment factor' for each unit.
 |
| PM2.5 levels from ODIN (colours) and reference instrument (grey) on one evening during the instrument comparison study |
The ODINs certainly aren't perfect. The adjusted data doesn't line up perfectly with the reference instrument. There were some days when some of the units disagreed with the majority and reported higher or lower concentrations. There may be interferences we haven't detected yet. But then, we are not necessarily expecting high performance from a low-cost device. To be more philosophical about it the degree of data quality required is defined by the objective of the study. An our current conclusion is that the quality of the ODIN data is sufficient for a wide range of objectives. Which objectives these are will be explored within the CONA study and in future blog posts.
Comments
Post a Comment