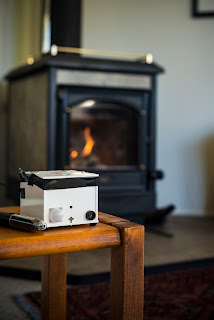
What does the PACMAN say?
Our keen tinkerer, Gustavo Olivares, started building the first PACMAN back in 2012, I think. We wanted a device that could not just measure indoor particle levels, but would give some clues as to what was causing and controlling them.
After 3 years of tests it was not until last year in Rangiora that we finally got around to using PACMAN for the job it was originally intended. Observing rapid changes in particle levels in real homes in a wood-burning setting.
The PACMAN technology is low cost and they are each custom-built by amateurs (we are air quality scientists not electronic engineers). Some of them failed, some reported data that was 'contaminated' (by what, we're not yet sure). But some worked beautifully and did exactly what we wanted.
Here's an image of a PACMAN in action. This is real data from one of our participant homes, covering one day. You can see three lines which are levels of measured dust, carbon dioxide and outdoor particle levels (PM10) measured by ECan in the centre of town.
Indoor levels of dust jump suddenly 3 times. There are also smaller short-term rises in dust levels, once in the morning and twice in the evening. The CO2 levels jump at the same time as one of the jumps in dust levels, but not the others.
You can see from this that we can not just observe these jumps in dust levels, but we can time them quite accurately. We can see if they correspond with changes in carbon dioxide (indicative of something burning) or not. We can see if they correspond to changes in outdoor air quality. If we do this over several days we can start to see if there are patterns - maybe related to cooking or heating habits. The plot below shows the timing (left to right) of peaks in dust and CO2 (blue) and dust only (orange) over a month. You can see there are some patterns of peaks occurring at around the same time several days, but also the number of blue dots reducing as the month progresses.
Our 2016 study is going to focus on how PACMAN can be used to further identify what the causes of these peaks are.
After 3 years of tests it was not until last year in Rangiora that we finally got around to using PACMAN for the job it was originally intended. Observing rapid changes in particle levels in real homes in a wood-burning setting.
The PACMAN technology is low cost and they are each custom-built by amateurs (we are air quality scientists not electronic engineers). Some of them failed, some reported data that was 'contaminated' (by what, we're not yet sure). But some worked beautifully and did exactly what we wanted.
Here's an image of a PACMAN in action. This is real data from one of our participant homes, covering one day. You can see three lines which are levels of measured dust, carbon dioxide and outdoor particle levels (PM10) measured by ECan in the centre of town.
Indoor levels of dust jump suddenly 3 times. There are also smaller short-term rises in dust levels, once in the morning and twice in the evening. The CO2 levels jump at the same time as one of the jumps in dust levels, but not the others.
You can see from this that we can not just observe these jumps in dust levels, but we can time them quite accurately. We can see if they correspond with changes in carbon dioxide (indicative of something burning) or not. We can see if they correspond to changes in outdoor air quality. If we do this over several days we can start to see if there are patterns - maybe related to cooking or heating habits. The plot below shows the timing (left to right) of peaks in dust and CO2 (blue) and dust only (orange) over a month. You can see there are some patterns of peaks occurring at around the same time several days, but also the number of blue dots reducing as the month progresses.


Comments
Post a Comment