What was the weather like during CONA?
Pretty typical, really! In terms of understanding air quality we’re usually interested in three things: temperature, wind speed and wind direction. Air temperature might tell us something about how much home heating is going on (or it might not – that’s one of the things we want to confirm in this study). Wind speed tells us how much air pollution is going to be dispersed and diluted. Poor air quality in most New Zealand towns usually occurs on evenings when there are a combination of light winds and colder temperatures.

Wind direction is interesting because firstly it is linked to wind speed and temperature. For example in Rangiora in winter south-westerly winds are often stronger and warmer and north-easterly winds are lighter and colder. Secondly, changes in wind direction may also tell us if smoke is being dispersed away from the town or just moved around.
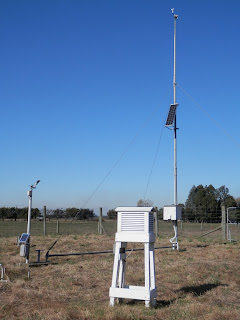
To find out what the weather was like we will firstly be looking at data from a permanent weather station on the edge of town run by NIWA, giving us data every ten minutes. Having measurements made on open fields away from buildings stops the data from being unduly influenced by obstacles which deflect or reduce the wind, or cast shadows or generate heat which would influence the temperature records.

For this post I will concentrate on the data from the permanent stations. First temperature. On average the air temperature was increasing by 0.1 degree C every day, or 3 degrees over a month, as we started to come out of the later stages of winter towards spring. But of course this change happens in fits and starts. In practice the project experienced three cycles of alternating cold and warm periods, each period lasting around 6 days, but with each cold period not quite as cold as the last. The coldest time of the day is nearly always shortly before dawn. The morning of 13thSeptember was the last time we recorded a temperature below zero degrees. The lowest temperature overall was -3 degrees just before dawn on the 24thAugust. However the warmest morning was 2nd September when we recorded a pre-dawn temperature of 10 degrees. We looked at data from August and early September over the past 10 years to determine what is “normal” for this time of year. Overall, the cold periods this year were not colder than normal, but they did last longer, and the warmer periods were not as warm as normal. The overall effect was that on average, overnight temperatures this year were 2 degrees colder than normal.

In terms of air quality we are most interested in the temperature when most people light their fires. We already posted that the most common time for our CONA participants to light their fires was between 6 and 7 pm. On most days the outdoor temperature at that time was remarkably consistent at between 6 and 10 degrees. On a few nights, however, it got as low as 2 degrees while on others got as high as 18 degrees. We will be checking our data later to see if these differences in outdoor temperatures influenced people’s decisions to light their fires or not.
Wind speed during the campaign followed a fairly typical pattern. Winds were usually higher in the afternoon, but usually fell in the early evening. Winds were lower than average during the second cold period (20th– 26th August). These are exactly the conditions we would expect to give rise to poor air quality. It was also during that period that we managed to conduct three all-night flights of the helikite. In our forthcoming analysis we will certainly be looking at this week in detail.
Air quality is also affected a little bit by rain. Rainfall is also measured at NIWA’s weather station. The data shows that there were small amounts of rain throughout out campaign, but notably none during this late-August cold period (except a little on the morning of the 25th), which also indicates potential for poor air quality during this period.
The wind direction data is complicated and deserves a post all of its own. All I will say for now is that the range of wind directions experienced was quite normal, but subtly different at our five stations. Those differences could be significant or understanding when Rangiora does and does not have poor air quality.
Comments
Post a Comment